Different modes of freight transport emissions
Paper代写范文:“Different modes of freight transport emissions”,这篇论文主要描述的是在不同的货运模式下所产生的气体排放量也更不相同,在降低货运的周转速度后,这样就导致了船舶在低功耗的情况下进行货运,这种低周转的货运模式,能够将原有的20%二氧化碳排放量降低至4%甚至更低,能够起到保护水域环境的作用。

The Freight Transportation Model can be used to compare modes while varying important input parameters such as capacity factor. Figure 6-5 shows that capacity factor has significant effect on the fuel consumption per ktonne cargo, and that the effect is greatest for trucks. This confirms the qualitative insights from previous analyses about the importance of capacity factor, presented in Section 5.1. Using average capacity factors, trucks consume more than twice as much fuel per ktonne as rail. (All model runs presented in this section use a cargo transportation distance of 3,218 km. The effect of changing transportation distance is discussed in Section 5.4.)

Figure 6-5. Fuel Consumption by Freight Transportation Mode as a Function of Capacity Factor.
Figure 6-6 presents similar results for CO2 emissions per ktonne cargo, including error bars representing the variability introduced by including different speed and power combinations.
Three important points should be noted. First, even with error bars the truck mode produces the highest CO2 emissions per ktonne cargo. Second, rail does not always perform significantly worse than ships, if different speed and power relationships are used for ships of the same type and size as the case-average container and general cargo ships. Third, bulk carriers and oil tankers in the case-average size ranges do perform significantly better than other ships, rail and truck.
When other pollutants are considered, the results can be different. NOx comparisons varied by capacity factor are presented in Figure 6-7. Ships still perform better than truck or rail modes, but this difference is not always large. Because significant NOx controls have been required for trucks, their NOx performance improves relative to the other modes. Additionally, more fuel-efficient diesel engines in rail and marine applications tend to operate at higher temperatures and pressures than truck engines, and therefore produce more NOx for the same power. Most interestingly, under average truck and rail capacity factors (85% for truck and 65% for rail), the NOx performance of these modes is nearly identical.
Figure 6-7. NOx Emissions Varied by Capacity Factor (with 5th and 95th percentile effects of variability shown)
Emissions differences between the modes are most noticeable for SOx (Figure 6-8). The fuel-sulphur contents for marine bunkers are much greater than distillate diesel fuels used by truck and rail modes. This results in SOx emissions per ktonne cargo that can be 6 to 26 times higher for ships than for land-based modes.
In summary, capacity-factor differences between the modes are significant, but modal differences between pollutants are much larger. The effects of changing capacity factors are not at all similar across pollutants. This is primarily due to modal differences in emission control, engine design, and fuel specifications. Under baseline model conditions, the CO2 performance by ships is clearly better than other modes of freight transportation.
One important input assumption is the turn-around time, because the corresponding energy use during this period can account for 4% to 15% of total energy use per trip for ships under baseline model assumptions. Reducing turn-around time – or at least minimising the energy used by ships during turn-around time – can reduce total energy and emissions intensities in two different ways. The reduced turn-around time per ship can result in more trips per ship per year, thus requiring fewer ships to perform the work. Alternatively, reduced turn-around time can be used to make transit-speed adjustments that maintain constant trip duration; this results in reduced power with the same number of ships performing the cargo movements. Each of these is discussed below.
A 25% reduction in turn-around time can reduce CO2 emissions by 1% to 4%, depending on the mode. In general, when turn-around times are a larger fraction of total energy use for each trip, reducing turn-around times has a larger effect in reducing CO2 emissions. (It should be noted that reduced turn-around times also reduce other emissions and improve overall energy performance.)
On the other hand, using these reductions to adjust transit speeds can provide additional reductions in energy use, CO2 emissions, and emissions of other pollutants. Figure 6-9 shows that given the baseline assumptions, a container ship can reduce transit speed by approximately 1 knot over a 3,218 km (2,000 mile) transit with a 6 hour (25%) reduction in turn-around time. The potential for turn-around time adjustments to reduce transit speed is greatest for faster vessels. For the case-average general cargo ship, the same reduction in turn-around time for the same 3,218 km transit allows for less than 1 knot speed reduction, and for the case-average tanker and bulk carrier the speed reduction is about 0.5 knots.
Figure 6-9. Speed Adjustment Potential to Maintain Constant Total Trip Time with Reduced Turn-Around Time for Baseline Scenario Distance of 3,218 km (2,000 miles)
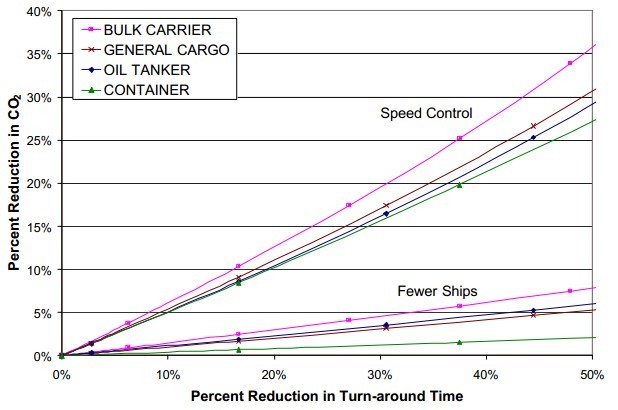
The Freight Transit Model shows that these relatively small reductions in speed afforded by improved turn-around times have the potential to reduce emissions. Figure 6-10 compares the percent CO2 reduction that results from reducing the required number of trips and ships with the percent CO2 reduction from transit speed adjustments. While reducing turn-around time alone provides a modest reduction in emissions, additional reductions can be achieved by using these gains to reduce energy and emissions during transit. Under baseline model conditions, a 25% reduction in turn-around time with speed control can reduce CO2 emissions by 14% to 17%, depending on ship type.
Figure 6-10. Comparison of Percent Fuel Consumption Variability with Terminal Turn-Around Time for Scenarios With and Without Open-Water Transit Speed Reduction
These results would be different under different model scenarios. Particularly, the transit distance has a significant effect on how much speed reduction can be achieved for a given reduction in turn-around time. To illustrate this, Figure 6-11 presents the same calculation for transit-speed reduction for three different distances. The baseline distance used in the model is 3,218 km (2,000 miles). For a distance of 805 km (500 miles), the same reduction in turn-around time can afford a much greater reduction in transit speed, because the turn-around time is a larger fraction of the total trip time. For a distance of 8,045 km (5,000 miles), the effect of reduced turn-around time on transit speed is much less.
Figure 6-11. Sensitivity of Transit Distance on Speed Adjustment to Maintain Constant Trip Time
(Baseline Scenario is 3,218 km)
As demonstrated, the turn-around time and resulting energy consumption are important factors in the overall energy and environmental performance of each mode. While the Model uses reasonable values for each mode, these may vary from port to port. Moreover, vessels different than case-average ships (e.g., mega-container ships or smaller coastal tankers) could require significantly different turn-around times than assumed here. Lastly, the average manoeuvring speeds during turn-around (terminal approach, docking and cargo transfer, and departure) vary from port to port, resulting in different energy and emissions performance even if the turn-around times are comparable. These regionally variable factors can be investigated with this Model.
51due留学教育原创版权郑重声明:原创留学生作业代写范文源自编辑创作,未经官方许可,网站谢绝转载。对于侵权行为,未经同意的情况下,51Due有权追究法律责任。
51due为留学生提供最好的悉尼paper代写服务,亲们可以进入主页了解和获取更多paper代写范文以及美国作业代写,详情可以咨询我们的客服QQ:800020041哟。-xz